ONS Unemployment Figures March-May 2016
Wednesday 20 July, 2016 Written by ONS
In Summary
For March to May 2016, 74.4% of people aged from 16 to 64 were in work, the highest since comparable records began in 1971.
Looking at employment rates by sex, for March to May 2016:
- 79.2% of men and 69.6% of women aged from 16 to 64 were in work
- the employment rate for men (79.2%) was higher than for a year earlier (78.1%)
- the employment rate for women (69.6%) was the highest since comparable records began in 1971, partly due to ongoing changes to the state pension age for women resulting in fewer women retiring between the ages of 60 and 65
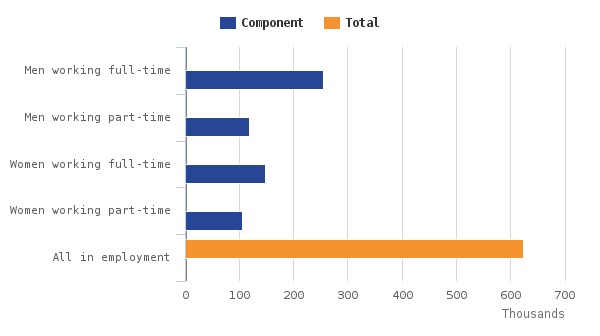
For March to May 2016, there were 31.70 million people in work, 176,000 more than for the 3 months to February 2016 and 624,000 more than for a year earlier.
In Detail
Between the 3 months to February 2016 and March to May 2016, the number of people in work increased. The number of unemployed people and the number of people not working and not seeking or available to work (economically inactive) fell.
There were 31.70 million people in work, 176,000 more than for the 3 months to February 2016 and 624,000 more than for a year earlier.
There were 23.19 million people working full-time, 401,000 more than for a year earlier. There were 8.52 million people working part-time, 223,000 more than for a year earlier.
The employment rate (the proportion of people aged from 16 to 64 who were in work) was 74.4%, the highest since comparable records began in 1971.
There were 1.65 million unemployed people (people not in work but seeking and available to work), 54,000 fewer than for the 3 months to February 2016, 201,000 fewer than for a year earlier and the lowest since March to May 2008.
There were 903,000 unemployed men, 108,000 fewer than for a year earlier. There were 742,000 unemployed women, 93,000 fewer than for a year earlier.
The unemployment rate was 4.9%, down from 5.6% for a year earlier. The last time it was lower was for July to September 2005. The unemployment rate is the proportion of the labour force (those in work plus those unemployed) that were unemployed.
There were 8.87 million people aged from 16 to 64 who were economically inactive (not working and not seeking or available to work), 46,000 fewer than for the 3 months to February 2016 and 181,000 fewer than for a year earlier.
The inactivity rate (the proportion of people aged from 16 to 64 who were economically inactive) was 21.6%, the lowest since comparable records began in 1971.
Average weekly earnings for employees in Great Britain in nominal terms (that is, not adjusted for price inflation) increased by 2.3% including bonuses and by 2.2% excluding bonuses compared with a year earlier.
Summary of latest labour market statistics
Table 1 and Figure 1 show the latest estimates, for March to May 2016, for employment, unemployment and economic inactivity and shows how these estimates compare with the previous quarter (the 3 months to February 2016) and the previous year (March to May 2015). Comparing the estimates for March to May 2016 with those for the 3 months to February 2016 provides the most robust short-term comparison. See Section 3 of this statistical bulletin for more information.
Table 1: Summary of UK labour market statistics for March to May 2016, seasonally adjusted
|
Number (thousands)
|
Change on Dec to Feb 2016 | Change on Mar to May 2015 | Headline Rate (%) | Change on Dec to Feb 2016 | Change on Mar to May 2015 |
| Employed | 31,705 | 176 | 624 | ||
| Aged 16 to 64 | 30,498 | 141 | 549 | 74.4 | 0.3 |
| Aged 65 and over | 1,206 | 35 | 76 | ||
| Unemployed | 1,646 | -54 | -201 | 4.9 | -0.2 |
| Aged 16 to 64 | 1,623 | -57 | -204 | ||
| Aged 65 and over | 22 | 3 | 3 | ||
| Inactive | 19,033 | -32 | -53 | ||
| Aged 16 to 64 | 8,874 | -46 | -181 | -0.1 | |
| Aged 65 and over | 10,160 | 14 | 127 | ||
|
Source: Office for National Statistics
|
|||||
| Notes: | |||||
|
|||||
|
|||||
Back in Work Breakdown
1 comment
-
Comment Link
 Wednesday 20 July, 2016
posted by
Simon Collyer
Wednesday 20 July, 2016
posted by
Simon Collyer
Leave a comment
Make sure you enter all the required information, indicated by an asterisk (*). HTML code is not allowed.
Join
FREE
Here