European Employment Improves but with Huge Regional Variations
Wednesday 01 June, 2016 Written by Simon Collyer
The Europeant jobless rate was stable at 10.2 percent in April, the same as March. But beware of averages because the discrepancies are huge. In Germany, the unemployment rate is 4.2 percent; in Greece, 24.2 percent.
At the beginning of 2000, above 20 million persons were unemployed in the EU-28, corresponding to 9.2 % of the total labour force. The unemployment trend at that moment was downwards. In the second quarter of 2001 the number of unemployment persons had dropped to 19.6 million and the unemployment rate to 8.7 %. A long period of increasing unemployment followed. At the end of 2004 the number of jobseekers available for work reached 21.1 million, while the unemployment rate was 9.2 %.
At the beginning of 2005 a period of steadily declining unemployment started, lasting until the first quarter 2008. At that time, EU-28 unemployment hit a low of 16.1 million persons (equivalent to a rate of 6.8 %) before rising sharply in the wake of the economic crisis. Between the second quarter 2008 and mid-2010 the unemployment level went up by more than 6.6 million, taking the rate up to 9.7 %, at that time the highest value recorded since the start of the series in 2000. The decline of unemployment in the following three quarters was a deceptive sign of an end of the crisis and of a stable improvement in labour market conditions in the EU-28. In fact, since the second quarter 2011 and until the first quarter of 2013 unemployment steadily and markedly increased taking it to the record level of 26.4 million, corresponding to a record rate of 10.9 %. Since then the rate has started to decrease, reaching 9.9 % at the end of 2014.
The unemployment rate in the euro area (EA-18) followed roughly the same trend as in the EU-28. However, between 2000 and the beginning of 2004 the unemployment rate in the euro area was below that recorded in the EU-28. This pattern was subsequently reversed as, between 2005 and the beginning of 2008, unemployment declined more rapidly in the Member States which do not yet have the euro. As in the EU-28, during the economic crisis unemployment increased at a considerable pace, with the exception of the period between mid-2010 and mid-2011 where it temporarily declined. The unemployment level peaked at 19.2 million in the second quarter of 2013, before going down in the second part of 2013 and in the course of 2014.
In 2000, the unemployment rate in the United States was around 4 %, considerably lower than in the EU. It remained much lower until early 2008, when unemployment started to increase rapidly. By the beginning of 2009 the unemployment rate in the United States had reached the same level as in the EU-28, and stayed above the EU-28 rate until the beginning of 2010. Since then the US unemployment rate has followed a downwards path which has taken it to 5.7 % at the end of 2014. In Japan, between 2000 and 2014, unemployment rates were much lower than in the EU, ranging between 3.5 % in the fourth quarter 2014 and 5.4 % in the third quarter 2009, when the rate started declining.
Youth unemployment trends
Youth unemployment rates are generally much higher, even double or more than double, than unemployment rates for all ages. As for the rate for the total population, the youth unemployment rate in the EU-28 sharply declined between 2005 and 2007, reaching its minimum value (15.2 %) in the first quarter 2008. The economic crisis, however, severely hit the young. From the second quarter of 2008, the youth unemployment rate has taken an upward trend peaking in 23.8 % in the first quarter 2013, before receding to 21.4 % at the end of 2014. The EU-28 youth unemployment rate was systematically higher than in the euro area between 2000 and mid-2007. Since then and until the third quarter 2010 these two rates were very close. Afterwards the indicator moved more sharply in the EA-18 than in the EU-28, first downwards until mid-2011, then upwards until the end of 2012 (see also Figure 5). In the middle of 2012 the euro area youth unemployment rate overtook the EU-28 rate, and the gap increased until the end of the year. The gap became even larger in the second part of 2013 and during 2014, when the rate for the euro area went down less than the rate for the EU-28.
High youth unemployment rates do reflect the difficulties faced by young people in finding jobs. However, this does not necessarily mean that the group of unemployed persons aged between 15 and 24 is large, as many young people are studying full-time and are therefore neither working nor looking for a job (so they are not part of the labour force which is used as the denominator for calculating the unemployment rate). For this reason, youth unemployment ratios are also calculated, according to a somewhat different concept: the unemployment ratio calculates the share of unemployed for the whole population. Table 1 shows that youth unemployment ratios in the EU are much lower than youth unemployment rates; they have however also risen since 2008 due to the effects of the crisis on the labour market.
Male and female unemployment trends
Historically, women have been more affected by unemployment than men. In 2000, the unemployment rate for women in the EU-28 was around 10 %, while the rate for men was below 8 %. By the end of 2002, this gender gaphad narrowed to around 1.5 percentage points and between 2002 and mid-2007 this gap remained more or less constant. Since the first quarter of 2008, when they were at their lowest levels of 6.3 % and 7.4 % respectively, the male and female unemployment rates in the EU-28 converged, and by the second quarter of 2009 the male unemployment rate was higher. The decline of the men’s rate during 2010 and the first half of 2011 and the corresponding stability in the women’s rate over the same period brought the male rate below the female one once again. Since then the two rates have risen at the same pace until mid-2013, when they reached their highest value, both at 10.9 %. In the second half of 2013 as well as during the course of 2014 both the male and the female rates declined, reaching respectively 9.8 % and 10.1 % at the end of 2014.
A detailed look at 2014
The overall unemployment rate in the EU-28 reached 10.2 % in 2014, decrease of 0.7 percentage points compared with 2013. This follows an increase of 0.4 percentage points between 2012 and 2013. In the United States the unemployment rate fell for the fourth year in a row, from 7.4 % in 2013 to 6.2 % in 2014.
The unemployment rate rose in 6 Member States between 2013 and 2014, dropped in 19 and remained stable in France, Croatia and Luxembourg. The increases in the annual average unemployment rates between 2013 and 2014 were recorded in Italy (+0.6 ppt), Finland (+0.5 ppt), Cyprus and Austria (both +0.2 ppt) as well as in Belgium and the Netherlands (both +0.1 ppt). The highest decreases were reported in Hungary (-2.5 ppt), Portugal (-2.3 ppt), Ireland (-1.8 ppt), Spain and Bulgaria (both -1.6 ppt) and the United Kingdom (-1.5 ppt). With 26.5 %, Greece was the country with the highest overall unemployment rate in 2014. The dispersion of unemployment across the EU-28 remained at approximately the same level as in 2013.
Long-term unemployment is one of the main concerns of policymakers. Apart from its financial and social effects on personal life, long-term unemployment negatively affects social cohesion and, ultimately, may hinder economic growth. In total, 5.1 % of the labour force in the EU-28 in 2014 had been unemployed for more than one year; more than half of these, 3.1 % of the labour force, had been unemployed for more than two years. Compared to 2013, a decrease is observed in the long term unemployment (from 5.2 %) while a sizeable increase (from 2.9 %) is registered among those being unemployed for two or more years.
For the first time since the calculation of EU-28 unemployment statistics started (in 2000), the unemployment rate for women was lower than that for men in 2009, and remained so in 2010. In 2011, this effect reversed again, with female unemployment rates at 9.7 % against 9.6 % for males. The gap has remained unchanged until 2013, when the two rates for the EU-28 peaked at 10.8 % for men and 10.9 % for women. In the euro area the rate has always been higher for women than for men. In 2014 the rates stood at 11.5 % for men and at 11.8 % for women. Male unemployment rates were higher than the corresponding rates for women during 2014 in 15 out of 28 Member States. The gap between male and female unemployment rates varied from -6.5 percentage points in Greece to +3.5 percentage points in Ireland.
The youth unemployment rate in the EU-28 was more than double the overall unemployment rate in 2014. At 22.2 %, more than one out of every five young persons in the labour force was not employed, but looking and available for a job. In the euro area, the youth unemployment rate was even higher at 23.8 %. The unemployment rate among young persons was higher than the rate for those aged between 25 and 74 in all Member States. In Spain (53.2 %), Greece (52.4 %), Croatia (45.5 %), Italy (42.7 %), Cyprus (35.9 %) and Portugal (34.7 %) youth unemployment rates were particularly high. Germany (7.7 %) was the only Member State with a youth unemployment rate below 10 %.
Educational qualifications are still the best insurance against unemployment, which clearly increases the lower the level of education attained. The average unemployment rate in the EU-28 for those aged between 25 and 64 having attained at most a lower secondary education was 18.2 %, much higher than the rate of unemployment for those that had obtained a tertiary education qualification (6.6 %).
Currently
Eurostat estimates that 21.224 million men and women in the EU-28, of whom 16.420 million were in the euro area were unemployed in April 2016. Compared with March 2016, the number of persons unemployed decreased by 106 000 in the EU-28 and by 63 000 in the euro area. Compared with April 2015, unemployment fell by 2 096 000 in the EU-28 and by 1 309 000 in the euro area.
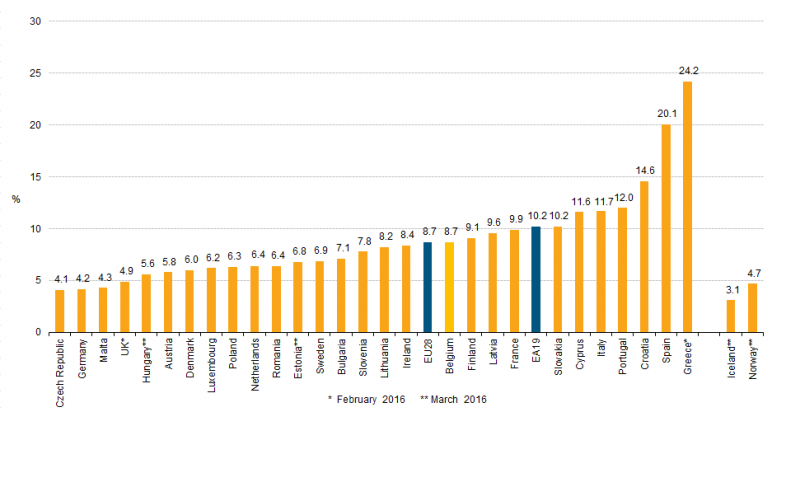
The euro area seasonally-adjusted unemployment rate was 10.2 % in April 2016, stable compared with March 2016, and down from 11.0 % in April 2015. The EU-28 unemployment rate was 8.7 % in April 2016, down from 8.8 % in March 2016, and from 9.6 % in April 2015.
Among the Member States, the lowest unemployment rates in April 2016 were recorded in the Czech Republic (4.1 %), Germany(4.2 %) and Malta (4.3 %). The highest rates have been observed in Greece (24.2 % in February 2016) and Spain (20.1 %).
Compared with a year ago, the unemployment rate in April 2016 fell in twenty-five Member States, remained stable in Belgium and increased in Estonia (from 6.7 % in March 2015 to 6.8 % in March 2016 ) and Latvia (from 9.5 % to 9.6 % ). The largest decreases were registered in Cyprus (from 15.7 % to 11.6 %), Bulgaria (from 10.0 % to 7.1 %) and Spain (22.7 % to 20.1 % ) .
In April 2016, the unemployment rate in the United States was 5.0 %, stable compared with March 2016, and down from 5.4 % in April 2015.
In April 2016, 4.235 million young persons (under 25) were unemployed in the EU-28, of whom 2.932 million were in the euro area. Compared with April 2015, youth unemployment decreased by 495 000 in the EU-28 and by 261 000 in the euro area. In April 2016, the youth unemployment rate was 18.8 % in the EU-28 and 21.1 % in the euro area, compared with 20.7 % and 22.5 % respectively in April 2015. In April 2016, the lowest rates were observed in Germany (7.0 %), Malta (8.9 % and the Czech Republic (9.5 %), and the highest in Greece (51.4 % in February 2016), Spain (45.0 %), Croatia (38.9 % in the first quarter 2016) and Italy (36.9 %).
Leave a comment
Make sure you enter all the required information, indicated by an asterisk (*). HTML code is not allowed.
Join
FREE
Here