 Self-Employment.
Index of employment since Q1 2008, seasonally adjusted, Q1 2008 = 100
Fig 1.
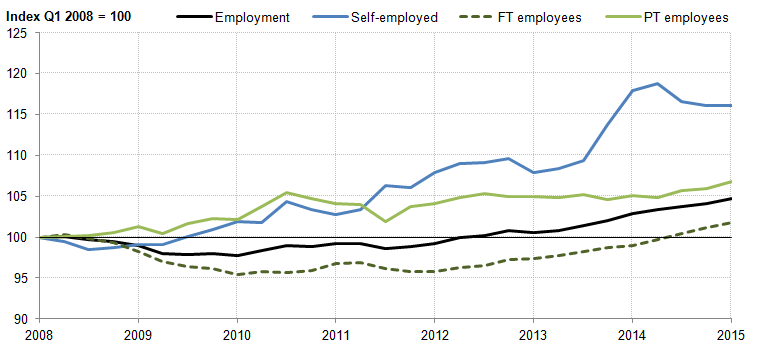
Fig 1. Figures from the ONS shows the initial recovery in employment has been largely a result of increases in the number of self-employed and part-time employees. The latter in particular is seen to be an indicator of a flexible labour market. The level of full-time employees (shown as the dashed line on the graph) only reached its pre downturn peak in mid-2014 but has been recovering strongly over the last three years.
As well as increases in employment, the number of hours worked in the economy continued to grow. The total number of hours worked per week increased by 0.2% on the quarter, falling just short of the 1 billion mark at 998.6 million hours.
Fig 2.
Unemployment rate and the rolling 18-month change in the unemployment rate, 16+ (%, percentage points)
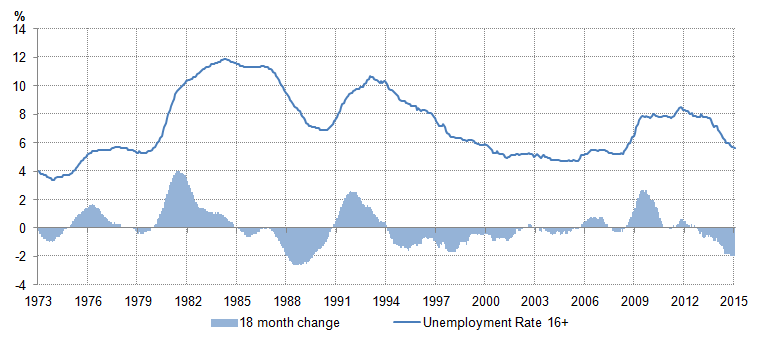
Fig 2. The relative strength of the labour market has been one of the most interesting characteristics of the UK’s recent economic performance. Higher unemployment accompanied the sharp fall in GDP in 2008 and 2009, but the rise in the number of people seeking work was less than might have been expected given historical experience. The output contractions which began in 1979 and 1990 of 5.6% and 2.2% respectively, resulted in unemployment rates of more than 10%, yet by contrast the 6.0% fall in GDP between Q1 2008 and Q2 2009 was accompanied by an unemployment rate of just over 8%. The fall in the unemployment rate since the start of the economic recovery has also been relatively sharp (Figure 3). Over the past eighteen months, the unemployment rate has declined almost 2 percentage points to 5.6% in the three months to February 2015 – among the fastest reductions in the past forty years – and is approaching its 2001 to 2007 average.
Fig 3.
Share of total employment accounted for by part-time employment (%)
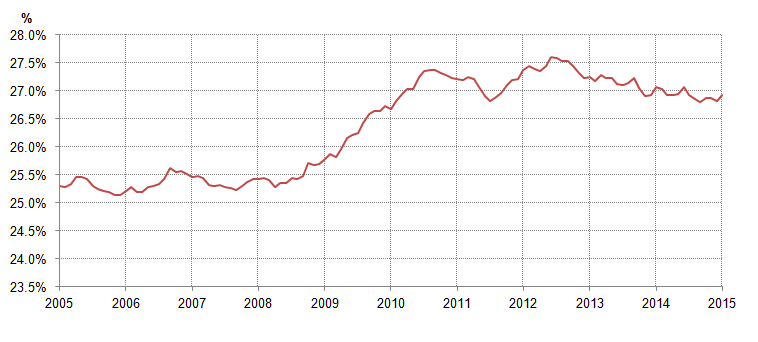
Fig 3. Both of these recent features of the UK’s economic performance are partly a consequence of flexibility in the labour market, which operates through several mechanisms. First, following an adverse shock, firms may seek to limit their costs of labour to remain in business by reducing the size of their workforce. Secondly, firms may reduce the number of hours worked – either by increasing the number of part-time workers that they employ, or by reducing the number of hours that existing employees work. Finally, if firms cannot reduce the quantity of labour they employ, they may seek to reduce the price of that labour by reducing wage growth. Each of these three channels appears to have played a role – but the latter two mechanisms may have helped to limit the extent to which firms responded to the economic downturn by reducing the size of their workforces.
In Summary
Employment has stayed higher than expected through flexibility. Self-employment has increased and so has part-time working.
Source: ONS.
1 comment
-
Comment Link
 Monday 05 October, 2015
posted by
Simon Collyer
Monday 05 October, 2015
posted by
Simon Collyer
Leave a comment
Make sure you enter all the required information, indicated by an asterisk (*). HTML code is not allowed.
Join
FREE
Here