The ONS Explain How The Unemployment Figues are Reached
Monday 12 November, 2018 Written by Simon Collyer
There is a lot of skepticism about the Unemployment Figures. If people are surveyed, it is argued – not counted - people will claim they are self-employed when they are really claiming and largely relying on benefits. We all have our pride after all. Large numbers of economically inactive people have disappeared as registered claimants and many are surviving on loans from friends, a partner or their parents support, or by trading in drugs like cannabis or in stolen goods. Crime has skyrocketed, and much of it is not reported.
The Essex Police rather foolishly announced in the press recently, that it has been alleged that you have to steal over £100's worth of goods to get charged for shoplifting. Certainly, in other shopping centers, you need to get stopped four times to get charged.
Thus, some people - thankfully a minority of people who are classed as economically inactive, are very active indeed, in a parallel economy. The losses are simply passed onto to customers at higher prices and then, of course, there is the cost of providing courts, the part privatized probation service, prisons and so on. The cost of failing to support young people via the benefits system is not saving at all. The cost just appears elsewhere.
There is an argument that as all countries and the EU and their politicians have a vested interest in portraying a more positive situation that is really the case - that they are all working the same scam some might argue. Most claimants do not commit a crime, they just soldier on. Under Universal, Credit rent arrears are soaring.
The UN's special investigator for poverty is visiting Jaywick as part of a look at the effects of austerity on the UK. Last week they visited Glasgow.
This is what the ONS have to say:
For months now, UK employment has been sitting at or near record highs. Naturally there has been speculation about what is driving the increase, and whether it is mainly because of people on ‘zero hours contracts.’ Jonathan Athow delves into the figures to show how we measure this important figure and what being ‘unemployed’ actually means for official statistics.
In recent months we have seen some very strong headline employment figures showing almost 32.4 million people in work. This from a total population of 41.2 million people aged 16-64. The Office for National Statistics (ONS) provides statistics on those working and out of work. We get this information from a very large survey of households called the Labour Force Survey. Most countries have a similar survey to collect and produce their employment figures.
A fairly common question is how we measure being in work or unemployed. How many hours do you need to work to count as being employed? And if you are not claiming benefits, can you be unemployed? Are these statistics distorted, or even misleading, because ONS includes people working as little as an hour a week?
As with many of our statistics, we use internationally agreed definitions. For employment figures, we use those set out by the International Labour Organization. So, for our UK labour market statistics, everyone aged 16 or over is either:
- employed (has worked at least one hour in the last two weeks);
- unemployed (does not have a job, has been actively seeking work in the past four weeks and is available to start work in the next two weeks, OR is out of work but has found a job and is waiting to start in the next two weeks); or
- economically inactive (does not have a job, has not been looking for a job in the past four weeks and/or is not available to start work in the next two weeks).
In addition to asking people whether they are working, we also ask about their hours of work, and counting people on zero hours contracts is something we are asked about at times. Because we measure their usual hours of work rather than their contracted hours, they are included in our employment figures. We do give a separate number solely for people on zero hours contracts in their main job, but it is worth pointing out they make up a relatively small share of total employment – about 2.5 per cent at the latest count.
But does that mean lots of people working very short hours – perhaps on zero hours contracts – are distorting our employment figures? That is certainly not what the data say. The chart below shows the share of employment by usual weekly hours of work, divided into five time bands.
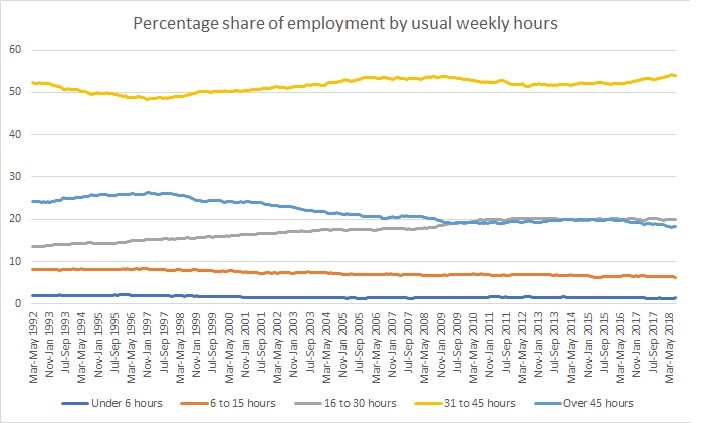
The share of people working very short hours – fewer than six hours a week – is very low, around 1.5 per cent, or a little over 400,000 people out of the 32.4 million people in work. This is down from around 2 per cent in the early to mid-1990s. The next category – from 6 to 15 hours a week – has also shrunk as a share of employment over the same period of time.
Just over half of employed people work between 31 and 45 hours a week. About 20 per cent of people work between 16 and 30 hours a week, while another 20 per cent work more than 45 hours a week. The pattern seems to be that hours of work at both extremes – fewer than six hours or more than 45 hours – have decreased over the past 25 years or so.
The other side of the coin is being out of work – so, either unemployed or economically inactive. The one that usually grabs the headlines is ‘unemployed.’ To be categorised as unemployed, you must be looking for work and be able to take up employment in the next two weeks. As set out above, we ask people this question directly in the Labour Force Survey. The response determines who counts as unemployed. So, whether you receive a benefit, or which benefit you might receive, does not determine whether you are classified as unemployed. We are more interested in your behaviour and intentions to work than in your benefit status.
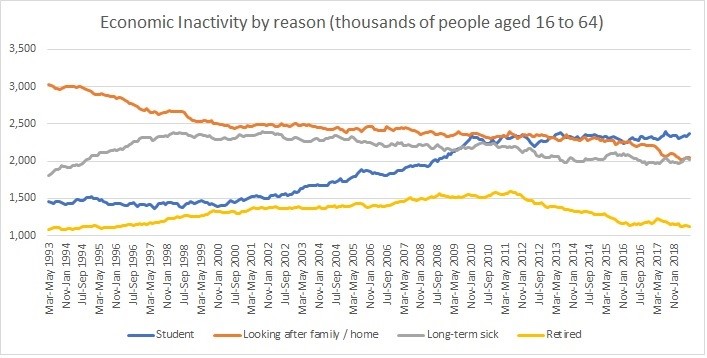
The third group, people who are economically inactive (outlined above), is also not defined by benefit receipt. Instead we ask people why they are not working. The three main reasons people aged 16-64 are economically inactive are study, looking after a family, and being long-term sick (obviously retirement would be a much more common reason for people aged 65 or over).
The outcome of all these standards, definitions and specific questions about people’s intentions about working is that we are confident our numbers are not being distorted by a (statistically small) number of people working very short hours. While we measure employment from just one hour a week, the share of people working very short hours has been falling, meaning these numbers actually have less of an impact now than previously. Finally, benefit receipt does not determine whether someone is classed as unemployed or ‘economically inactive’, and so does not influence our statistics.
As noted above, all of this information comes from our Labour Force Survey. Every three months, we ask approximately 90,000 randomly selected people for a few minutes of their time to respond to our Labour Force Survey interviewers face-to-face or over the phone. So if you are approached by the ONS to take part, thanks in advance for your time – without your input, we wouldn’t be able to produce the figures that we do to measure this vital aspect of the British economy.
ABC Note: As we say here about statistics - on a less than serious note - 90% of people are not sure if they believe in statistics or not, and the other 10% don’t know (boom boom).

Image: Jonathan Athow is Deputy National Statistician for Economic Statistics

Image: Some unemployed young people are turning their back on society.
ABC Comment: Have your say below:

Leave a comment
Make sure you enter all the required information, indicated by an asterisk (*). HTML code is not allowed.
Join
FREE
Here