Insolvency Statistics – January to March 2018 Shows Significant Increase
Friday 13 July, 2018 Written by Simon Collyer
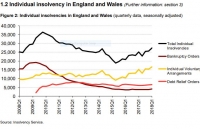
There were 27,388 individual insolvencies in Q1 2018, consisting of 16,676 individual voluntary arrangements (IVAs, 61% of the total), 6,524 debt relief orders (DROs, 24%) and 4,188 bankruptcies (15%).
Individual insolvencies increased this quarter, reaching a five-year high
Total individual insolvencies in Q1 2018 were 6.8% higher than in the previous quarter, and 8.5% higher than in the same quarter the previous year. This continued the increasing trend observed since 2015 and was the highest quarterly total since Q3 2012.
This was mainly driven by an increase in IVAs which rose to a new high The number of IVAs in Q1 2018 rose 8.3% compared with Q4 2017. This was the largest quarterly number of IVAs since they were introduced in 1987. Bankruptcies were higher than a year ago Bankruptcies overall rose by 9.6% on the quarter and also by 9.3% on the year.
Bankruptcies on both debtors’ own applications and creditors’ petitions increased on the quarter and on the same corresponding quarter in 2017. Debt relief orders (DROs) also increased DROs increased by 1.3% on the quarter and by 6.9% on the same quarter in 2017. The insolvency rate increased In the 12 months ending Q1 2018, the rate of insolvency was 21.8 per 10,000 adults (1 in 458 adults).
Image:
Company insolvencies the first quater this year have also increased.
ABC Note: An individual voluntary arrangement (IVA) is a formal agreement allowing you to make affordable payments to your debts, usually over five or six years. At the end of your IVA any unsecured debt left is written off. You can also make a one-off payment known as a lump-sum IVA. There are disadvantages however and you need to take advice before taking this route.
ABC Note: Have your say:

1 comment
Leave a comment
Make sure you enter all the required information, indicated by an asterisk (*). HTML code is not allowed.
Join
FREE
Here


