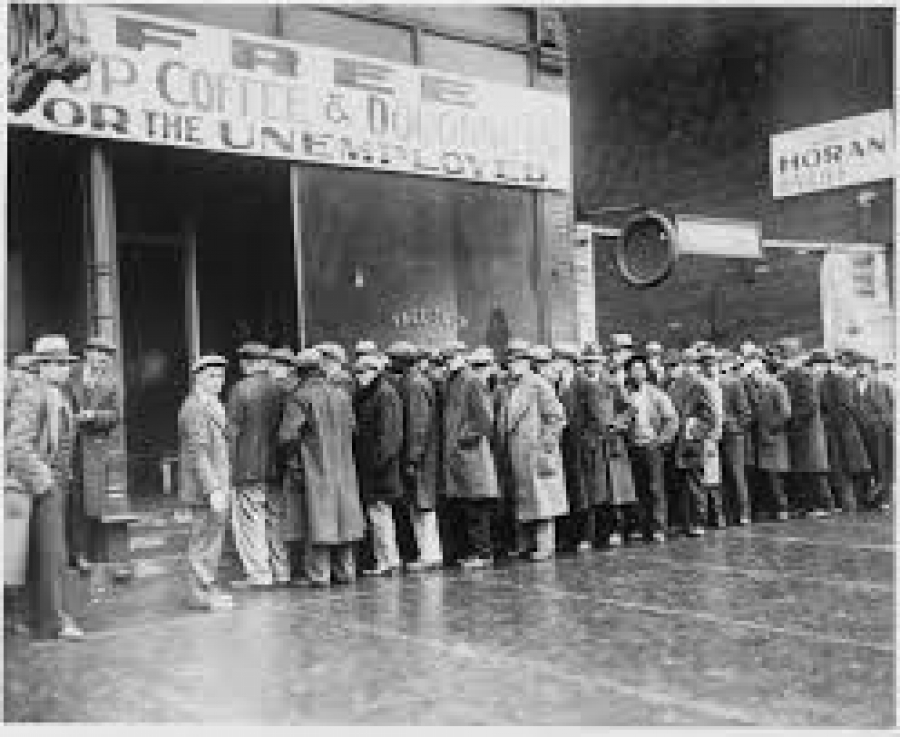
 Free Coffee
Key Points for September to November 2014
- Comparing the estimates for September to November 2014 with those for June to August 2014, employment continued to rise and unemployment continued to fall. These changes maintain the general direction of movement since late 2011/early 2012.
- There were 30.80 million people in work. This was 37,000 more than for June to August 2014, the smallest quarterly increase since March to May 2013. Comparing September to November 2014 with a year earlier, there were 512,000 more people in work.
- The proportion of people aged from 16 to 64 in work (the employment rate), was 73.0%, unchanged from June to August 2014 but higher than for a year earlier (72.0%).
- There were 1.91 million unemployed people. This was 58,000 fewer than for June to August 2014, the smallest quarterly fall since July to September 2013. Comparing September to November 2014 with a year earlier, there were 418,000 fewer unemployed people.
- The unemployment rate was 5.8%, lower than for June to August 2014 (6.0%) and lower than for a year earlier (7.1%). The unemployment rate is the proportion of the economically active population (those in work plus those seeking and available to work) who were unemployed.
- There were 9.09 million people aged from 16 to 64 who were out of work and not seeking or available to work (known as economically inactive). This was 66,000 more than for June to August 2014 and 41,000 more than for a year earlier.
- The proportion of people aged from 16 to 64 who were economically inactive (the inactivity rate) was 22.4%, slightly higher than for June to August 2014 (22.2%) and for a year earlier (22.3%).
- Comparing September to November 2014 with a year earlier, pay for employees in Great Britain increased by 1.7% including bonuses and by 1.8% excluding bonuses.
As we can see from this table undermployment is very high.
| Underemployed workers1 in the labour market | |||||
| Level and rate of underemployed workers, 2000 to 2014, UK | |||||
| Underemployment Rate | |||||
| Underemployed | Total Count2 | Underemployment Rate3 | 4 Quarter rolling average | ||
| Thousands | Thousands | Percentage | Percentage | ||
| 2000 | January-March | 2,093 | 26,953 | 7.8 | |
| April-June | 2,084 | 27,117 | 7.7 | ||
| July-September | 2,189 | 27,382 | 8.0 | ||
| October-December | 2,035 | 27,294 | 7.5 | 7.7 | |
| 2001 | January-March | 1,986 | 27,207 | 7.3 | 7.6 |
| April-June | 1,826 | 27,358 | 6.7 | 7.4 | |
| July-September | 1,938 | 27,563 | 7.0 | 7.1 | |
| October-December | 1,897 | 27,551 | 6.9 | 7.0 | |
| 2002 | January-March | 1,870 | 27,384 | 6.8 | 6.9 |
| April-June | 1,871 | 27,579 | 6.8 | 6.9 | |
| July-September | 1,936 | 27,757 | 7.0 | 6.9 | |
| October-December | 1,849 | 27,853 | 6.6 | 6.8 | |
| 2003 | January-March | 1,867 | 27,713 | 6.7 | 6.8 |
| April-June | 1,839 | 27,881 | 6.6 | 6.7 | |
| July-September | 1,909 | 28,049 | 6.8 | 6.7 | |
| October-December | 1,878 | 28,031 | 6.7 | 6.7 | |
| 2004 | January-March | 1,857 | 28,046 | 6.6 | 6.7 |
| April-June | 1,783 | 28,104 | 6.3 | 6.6 | |
| July-September | 1,855 | 28,325 | 6.5 | 6.6 | |
| October-December | 1,794 | 28,402 | 6.3 | 6.5 | |
| 2005 | January-March | 1,820 | 28,348 | 6.4 | 6.4 |
| April-June | 1,842 | 28,406 | 6.5 | 6.4 | |
| July-September | 1,900 | 28,744 | 6.6 | 6.5 | |
| October-December | 1,881 | 28,615 | 6.6 | 6.5 | |
| 2006 | January-March | 1,936 | 28,658 | 6.8 | 6.6 |
| April-June | 1,868 | 28,729 | 6.5 | 6.6 | |
| July-September | 2,032 | 28,944 | 7.0 | 6.7 | |
| October-December | 2,012 | 28,928 | 7.0 | 6.8 | |
| 2007 | January-March | 2,079 | 28,780 | 7.2 | 6.9 |
| April-June | 1,968 | 28,902 | 6.8 | 7.0 | |
| July-September | 2,135 | 29,167 | 7.3 | 7.1 | |
| October-December | 2,091 | 29,277 | 7.1 | 7.1 | |
| 2008 | January-March | 2,153 | 29,194 | 7.4 | 7.2 |
| April-June | 2,078 | 29,246 | 7.1 | 7.2 | |
| July-September | 2,258 | 29,331 | 7.7 | 7.3 | |
| October-December | 2,367 | 29,230 | 8.1 | 7.6 | |
| 2009 | January-March | 2,628 | 28,911 | 9.1 | 8.0 |
| April-June | 2,710 | 28,598 | 9.5 | 8.6 | |
| July-September | 2,851 | 28,759 | 9.9 | 9.1 | |
| October-December | 2,777 | 28,731 | 9.7 | 9.5 | |
| 2010 | January-March | 2,812 | 28,470 | 9.9 | 9.7 |
| April-June | 2,754 | 28,696 | 9.6 | 9.8 | |
| July-September | 3,014 | 29,048 | 10.4 | 9.9 | |
| October-December | 2,988 | 28,945 | 10.3 | 10.0 | |
| 2011 | January-March | 2,918 | 28,895 | 10.1 | 10.1 |
| April-June | 2,841 | 28,973 | 9.8 | 10.2 | |
| July-September | 2,997 | 28,949 | 10.4 | 10.1 | |
| October-December | 3,045 | 28,956 | 10.5 | 10.2 | |
| 2012 | January-March | 3,036 | 28,897 | 10.5 | 10.3 |
| April-June | 3,062 | 29,088 | 10.5 | 10.5 | |
| July-September | 3,175 | 29,324 | 10.8 | 10.6 | |
| October-December | 3,118 | 29,446 | 10.6 | 10.6 | |
| 2013 | January-March | 3,159 | 29,237 | 10.8 | 10.7 |
| April-June | 3,091 | 29,314 | 10.5 | 10.7 | |
| July-September | 3,139 | 29,631 | 10.6 | 10.6 | |
| October-December | 3,133 | 29,816 | 10.5 | 10.6 | |
| 2014 | January-March | 3,144 | 29,912 | 10.5 | 10.5 |
| April-June | 2,975 | 30,123 | 9.9 | 10.4 | |
| Source: ONS, Labour Force Survey datasets | |||||
| 1Underemployed workers are those who are employed but who either wish to work more hours in their current role | |||||
| or who are looking for an additional job or for a replacement job which offers more hours. They must also be over 16 | |||||
| and be currently working under 40 hours per week if they are between 16 and 18 and under 48 hours if they are over 18. | |||||
| Finally, they must be able to start working extra hours within the next two weeks | |||||
| 2 This total excludes those workers who have unknown underemployment status | |||||
| 3 This is calculated by dividing the total number of underemployed workers by the total number of people in employment | |||||
| that have a known underemployment status | |||||
Leave a comment
Make sure you enter all the required information, indicated by an asterisk (*). HTML code is not allowed.
Join
FREE
Here