Social & Health Spending 1900-2020
Sunday 07 May, 2017 Written by UK Public Spending Chart: Social Spending 1900-2020
Public spending for “Social Protection” started at 0.7 percent of GDP in 1900 and has now reached over 15 percent of GDP.
At the beginning of the 20th century, government spent about 0.7 percent of GDP on social protection, almost entirely social assistance or welfare, slowly increasing spending to 1.38 percent of GDP at the outbreak of war in 1914.
Social spending exploded after World War I, peaking at 2.2 percent of GDP on welfare in 1922 and 2.25 percent on pensions in 1921. Pensions slowly decreased over the next 20 years to 0.4 percent of GDP by the end of World War II. But welfare payments declined only to 1.9 percent of GDP in the mid-1920s before jumping up to 2.4 percent of GDP after the General Strike in 1926. The Great Depression provoked a further increase in welfare payments, up to 3.66 percent of GDP in 1933. Thereafter, welfare payments declined to about 1.5 percent of GDP in the middle of World War II.
After World War II welfare payments jumped sharply to 3.2 percent of GDP in 1948 before declining back to about 3 percent of GDP for most of the 1950s. But welfare started increasing by the late 1950s reaching 4.0 percent of GDP by 1962. Pensions hit 2.2 percent of GDP right after World War II and slowly increased in the 1950s, reaching 3.1 percent of GDP in 1961.
Welfare payments grew steadily throughout the 1960s, breaching 5 percent in 1966, and 5.4 percent in 1968. Pensions continued a steady growth, reaching 3.9 percent of GDP by 1968.
Welfare started out the 1970s at at 5.35 percent of GDP in 1970 and then hit 6 percent of GDP in 1974 and continued to increase through the inflation and strikes of the late 1970s hitting 7 percent of GDP in the recession of 1981. Pensions started out the 1970s at 3.8 percent of GDP and steadily increased thereafter, hitting 4 percent of GDP in 1973 and 5 percent of GDP in 1981.
In the Thatcher years of the 1980s-welfare increased by the mid-1980s to 7.4 percent of GDP by 1984 before declining to 6.4 percent of GDP by 1989. Pensions peaked at 5.05 percent of GDP before declining steadily to 4.2 percent of GDP by 1990.
Starting in 1993 with the new HM Treasury PESA, welfare, including unemployment, social security, incapacity and housing allowances, pegged at 8.25 percent of GDP; pensions came in at 5.28 percent of GDP.
Following 1993, welfare started a decline, reaching down to a low of 5.5 percent of GDP in 2002. In the financial crisis of 2008 it increased, reaching 7.8 percent of GDP in 2010. Welfare is expected to decline to 6.6 percent of GDP by the mid-2010s.
Following 1993, pensions began a steady increase, reaching just under 6 percent of GDP in 1998, breaching 7 percent of GDP in 2001 to peak at 7.28 percent of GDP in 2002. In the mid-2000s pensions modestly declined down to 6.68 percent of GDP in 2007. But the financial crisis boosted pension costs up to 8 percent of GDP in 2010 and 8.8 percent of GDP for 2013.
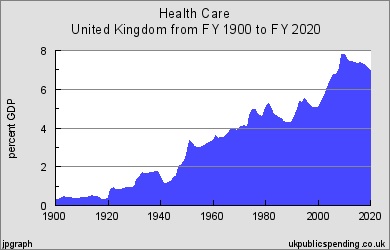
Chart: Health Spending 1900-2020
Public spending for health services increased steadily through most of the 20th century, from 0.3 percent of GDP to six percent of GDP by 1980. Following a mild decline in the 1980s and 1990s, health spending increased rapidly in the 2000s to a peak of 8 percent of GDP in 2009.
At the beginning of the 20th century, government spent about 0.5 percent of GDP on health. But spending began to increase in 1909 after passage of the National Insurance Act, reaching 1.14 percent of GDP in 1921.
Health spending increased steadily in the 1920s and 1930s reaching 1.91 percent of GDP at the start of World War II. Spending kept steady during the war and then increased briskly after the war, reaching 3.07 percent just before the National Health Service was set up in 1948.
Costs rose sharply in the early years of the NHS, reaching 3.6 percent of GDP by 1950 and then dropping to 3.0 percent of GDP by 1955. Spending increased steadily after the mid-1950s, running at about 3.5 percent of GDP in the early 1960s and increasing to 4.0 percent of GDP by 1970 and peaking at 4.98 percent of GDP in 1975.
Health spending declined in the late 1970s, down to 4.7 percent of GDP in 1979 and increased thereafter, reaching 5.24 percent of GDP in 1981 before beginning a decline to 4.28 percent in 1988. Then spending began increased to 5.35 percent of GDP in 1993 and declined to 4.9 percent of GDP by 1998.
Spending began increasing sharply after 1999, and reached 8.01 percent of GDP in 2009. Planned health care spending in the mid-2010s is expected to hold just below 8 percent of GDP.
Information Courtesy of UK Public Spending
Leave a comment
Make sure you enter all the required information, indicated by an asterisk (*). HTML code is not allowed.
Join
FREE
Here