ONS Figures Shows Employment Falling Post BREXIT
Wednesday 14 December, 2016 Written by Simon Collyer Employment Seasonally Adjusted 1976- October 2016
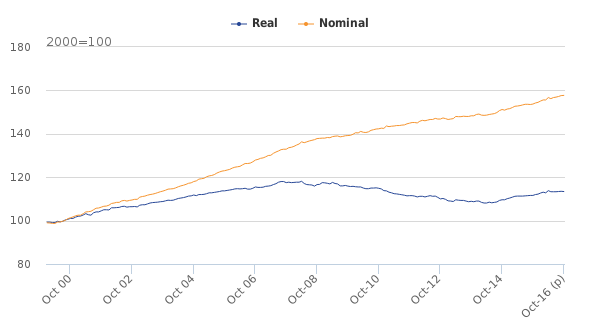
The figures show the recent movements in real AWE (whole economy). This is calculated as nominal unadjusted AWE, divided by the Consumer Prices Index (CPI). This series is calculated for regular and total pay at the whole economy level and then seasonally adjusted. The data in Figures 1 and 2 are levels of real and nominal AWE, shown on a monthly basis, with an index of 2000 = 100.
Comparing the 3 months to October 2016 with the same period in 2015, real AWE (total pay) grew by 1.7%, the same as the growth seen in the 3 months to September. Nominal AWE (total pay) grew by 2.5% in the 3 months to October, while the CPI increased by 0.9% in the year to October 2016. Over the same 3-month period, real AWE (regular pay) grew by 1.7%, the same as the growth seen in the 3 months to September. The nominal AWE (regular pay) rose by 2.6% in the 3 months to October.
The graph below show real wages have fallen 2000-2016.
Between May to July 2016 and August to October 2016, the number of people in work was little changed, the number of unemployed people decreased, and the number of people not working and not seeking or available to work (economically inactive) increased.
There were 31.76 million people in work, little changed compared with May to July 2016 but 342,000 more than for a year earlier.
Graph below Unemployment
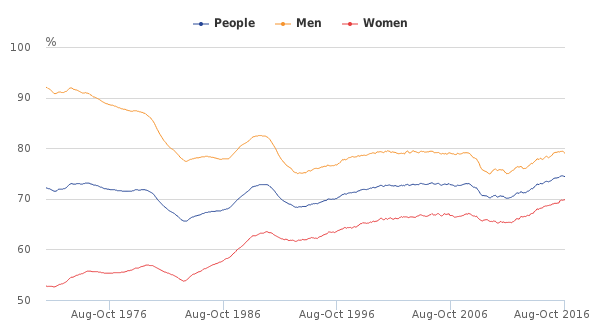
There were 23.20 million people working full-time, 235,000 more than for a year earlier. There were 8.56 million people working part-time, 107,000 more than for a year earlier.
For the 3 months ending October 2016, the highest employment rate in the UK was in the South East (78.1%) and the lowest was in Northern Ireland (69.5%). The employment rate estimates for those aged 16 to 64, for August to October 2016 compared with May to July 2016, showed a range of reasonably large increases and decreases for the regions and countries of the UK.
Figures courtesy ONS
Leave a comment
Make sure you enter all the required information, indicated by an asterisk (*). HTML code is not allowed.
Join
FREE
Here