House Prices Continue Upwards and Fuel Prices Increase
Wednesday 14 December, 2016 Written by Simon Collyer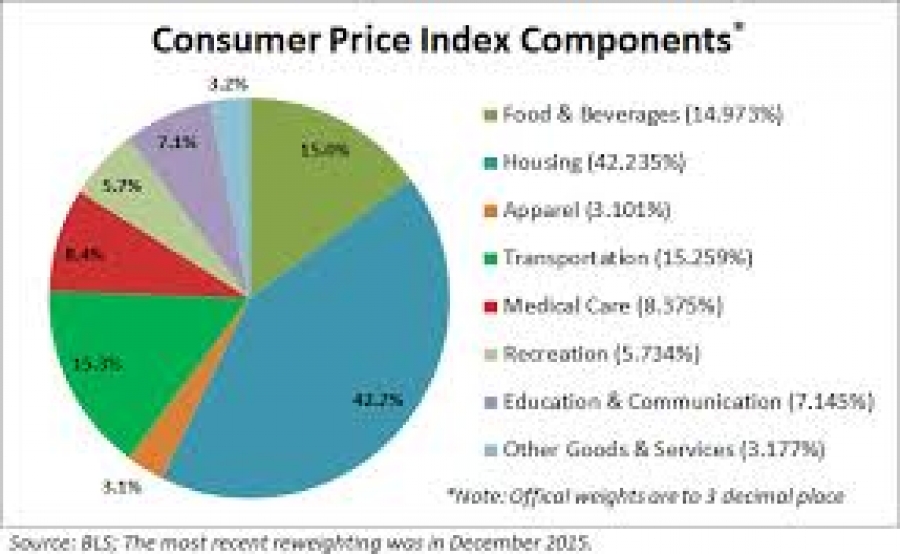 Consumer Price Index
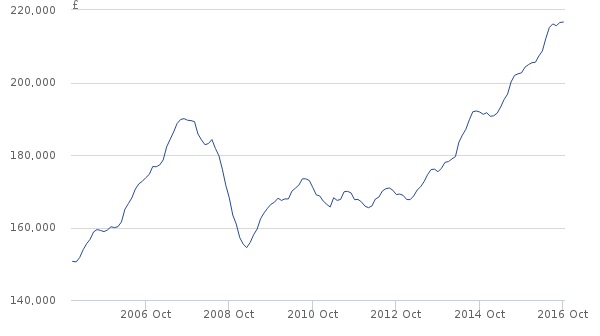
The main contribution to the increase in UK house prices came from England, where house prices increased by 7.4% over the year to October 2016, with the average price in England now £233,000. Wales saw house prices increase by 4.4% over the last 12 months to stand at £147,000.
In Scotland, the average price increased by 4.0% over the year to stand at £143,000. The average price in Northern Ireland currently stands at £124,000.
The figure below shows how prices are continuing upwards.
Meanwhile Fuel Prices are increasing due to international prices rises and the drop in the value of the currency due to the BREXIT uncertainty.
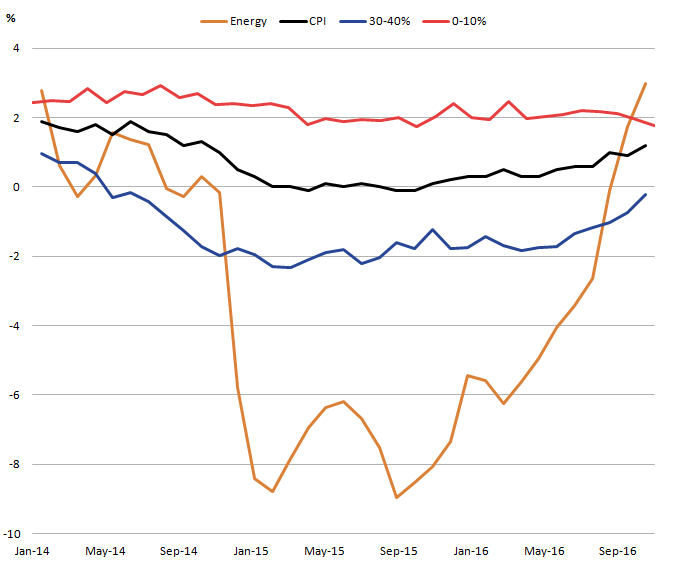
The energy component has experienced the largest changes in prices over the last 2 years. About half of this component is made up of fuels and lubricants, which has been affected by the recent fall and subsequent recovery of the crude oil price.
In November, prices of the energy component grew by 3% compared with the previous year, making it the fastest growing group; the first time this has happened since January 2014. The recent increase in prices for this group is likely to be due to a combination of the recovering oil price, as well as the depreciation of sterling.
As well as energy, all groups showed higher inflation rates in November 2016 than the previous month, with the exception of the lowest import-intensive group (0 to 10%). The main change over the last few months has come from the 30 to 40% component. The annual price change of this group rose from negative 1.7% in June to negative 0.2% in November 2016. Along with energy, components in this group have been the main drivers to the increase in the CPI in recent months.
The graph below shows the contributions the different groups make to the CPI, along with the inverted effective exchange rate (ERI). The ERI series has been inverted so that a depreciation of the currency is represented by an increase in the line graph, helping to interpret a depreciation of the currency as representing a higher sterling equivalent price for imported goods and services.
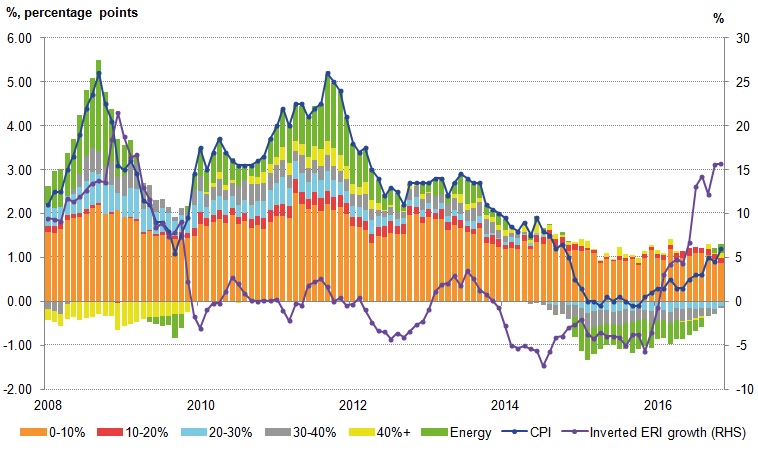
Image: Headline CPI Inflation November 2016
The rate of inflation as measured by the Consumer Prices Index (CPI) was 1.2% in the year to November 2016, compared with a 0.9% annual increase in the previous month. The CPI data for November 2016 is the fifth month to include information gathered since the UK’s referendum on its membership of the European Union and the changes in the sterling exchange rate which followed.
The graph below presents the 12-month growth rate in prices of products grouped by their relative import intensities. Goods and services which largely originate from domestic producers are grouped together in a low import intensity group, while products which largely come from abroad are grouped into higher import intensity groups. Energy products – which have considerable import content, on which the price of oil has a particular impact – are grouped separately.
Figures courtesy of the Office of National Statistics ONS
1 comment
-
Comment Link
 Wednesday 14 December, 2016
posted by
Simon Collyer
Wednesday 14 December, 2016
posted by
Simon Collyer
Leave a comment
Make sure you enter all the required information, indicated by an asterisk (*). HTML code is not allowed.
Join
FREE
Here