Household Spending Returned to Pre-Economic Downturn Levels
Thursday 29 March, 2018 Written by Simon Collyer
As the National Living Wage increases to £7.83 per hour on 1 April 2018, find out whether your lifestyle would be affordable on the National Living Wage. It takes someone on the average UK salary seven months to earn the annual salary of someone earning the NLW.
Main Points
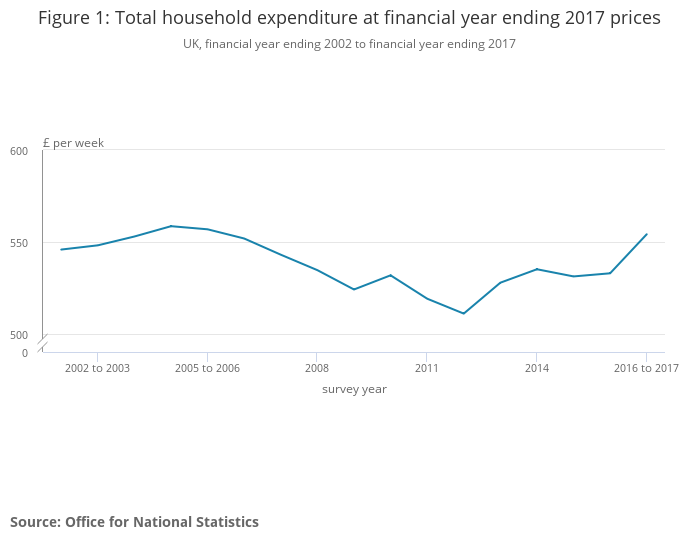
Average weekly household spending rose to £554.20 in the financial year ending 2017; in real terms, this was a return to pre-economic downturn levels.
Households spent an average of £79.70 a week on transport, an increase of £5.40 in real terms when compared with the previous year; this makes transport the top spending category.
When comparing between English regions and UK constituent countries, average weekly household spending differed by more than £200.
Households in the 65-to-74-year-old age group spent nearly a fifth of their total spending on recreation and culture.
Households without children spent a higher proportion of their total spending on transport than households with children.
Average weekly spending of a 15-year-old was more than three times that of a 7-year-old.
ABC Note: The National Living Wage is the amount of money all employees aged over 25 are legally entitled to. It used to be known as the National Minimum Wage, but it was re-branded in 2016.The amount is lower than the real living wage which many organisations are signing up to. It was a clever bit of manoeuvring by the government to make themselves look more generous than they have actually been.
Leave a comment
Make sure you enter all the required information, indicated by an asterisk (*). HTML code is not allowed.
Join
FREE
Here