UK Employment Up - However Wages And Hours Worked Falling
Wednesday 24 January, 2018 Written by Simon Collyer
UK unemployment fell by 3,000 to 1.44 million in the three months to November, official figures show.
Main points for September to November 2017
Estimates from the Labour Force Survey show that, between June to August 2017 and September to November 2017, the number of people in work increased, the number of unemployed people was little changed, and the number of people aged from 16 to 64 not working and not seeking or available to work (economically inactive) decreased.
There were 32.21 million people in work, 102,000 more than for June to August 2017 and 415,000 more than for a year earlier.
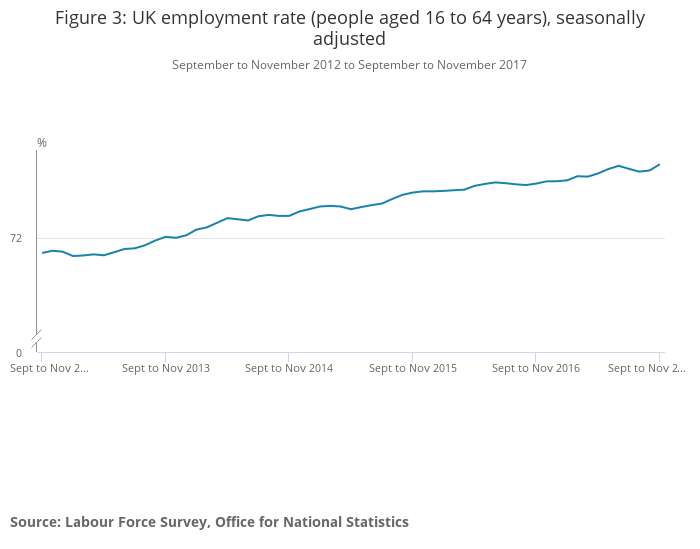
The employment rate (the proportion of people aged from 16 to 64 who were in work) was 75.3%, higher than for a year earlier (74.5%) and the joint highest since comparable records began in 1971.
There were 1.44 million unemployed people (people not in work but seeking and available to work), little changed compared with June to August 2017 but 160,000 fewer than for a year earlier.
The unemployment rate (the proportion of those in work plus those unemployed, that were unemployed) was 4.3%, down from 4.8% for a year earlier and the joint lowest since 1975.
There were 8.73 million people aged from 16 to 64 who were economically inactive (not working and not seeking or available to work), 79,000 fewer than for June to August 2017 and 167,000 fewer than for a year earlier.
The inactivity rate (the proportion of people aged from 16 to 64 who were economically inactive) was 21.2%, lower than for a year earlier (21.7%) and the joint lowest since comparable records began in 1971.
Latest estimates show that average weekly earnings for employees in Great Britain in nominal terms (that is, not adjusted for price inflation) increased by 2.5% including bonuses and by 2.4% excluding bonuses, compared with a year earlier.
Latest estimates show that average weekly earnings for employees in Great Britain in real terms (that is, adjusted for price inflation) fell by 0.2% including bonuses, and fell by 0.5% excluding bonuses, compared with a year earlier.
ABC comment:
Between June to August 2017 and September to November 2017, total hours worked per week decreased by 4.9 million to 1.03 billion. While employment has increased by 102,000, the average hours worked by people in employment has fallen.
For September to November 2017:
-
people worked, on average, 31.9 hours per week, fewer than for June to August 2017 and for a year earlier
-
people working full-time worked, on average, 37.2 hours per week in their main job, fewer than for June to August 2017 and for a year earlier
-
people working part-time worked, on average, 16.1 hours per week in their main job, fewer compared with June to August 2017 but unchanged compared with a year earlier
Wages are falling and working hours are falling. So althought it looks positive on the surface it is not so positive if you drill into the figures.
1 comment
-
Comment Link
 Wednesday 24 January, 2018
posted by
Simon Collyer
Wednesday 24 January, 2018
posted by
Simon Collyer
Leave a comment
Make sure you enter all the required information, indicated by an asterisk (*). HTML code is not allowed.
Join
FREE
Here